In the first guide, all the prerequisites and the essential calculated fields necessary for constructing a dendrogram were covered. Now that we have a solid understanding of the purpose behind each of these fields, applying them to create dendrograms becomes much simpler. With that foundation in place, we can now dive into the process of actually building dendrograms in Tableau.
Let's begin by exploring the key concepts of single-level and multilevel dendrograms before we move into the steps for creating them.
Single vs. Multilevel Dendrograms
A single-level dendrogram represents a hierarchy within one dimension. In our case, creating a dendrogram for subcategories or categories separately would be considered a single-level dendrogram, as it represents a single hierarchy.
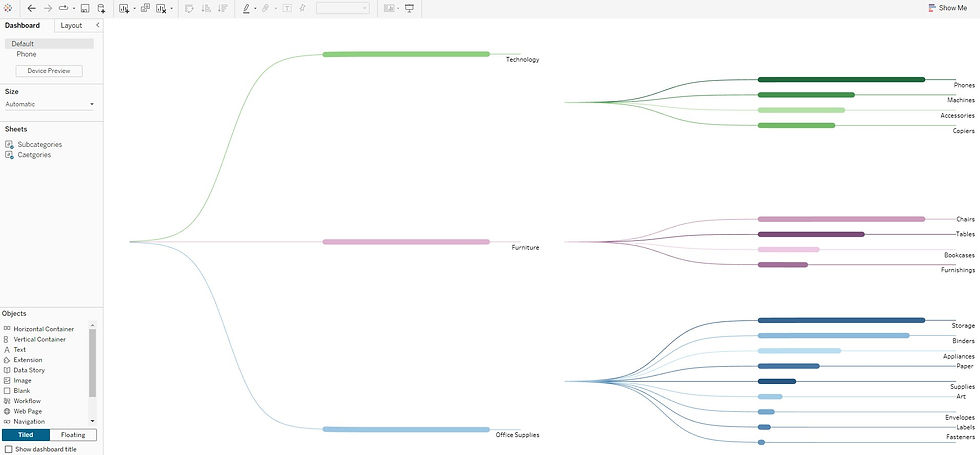
A multilevel dendrogram, however, involves multiple layers of hierarchy. For instance, visualizing categories and their corresponding subcategories forms a multilevel dendrogram, showing a more detailed, layered relationship between data points.
In this guide, we’ll focus on constructing two single-level dendrograms—one for subcategories and one for categories. Then, we will combine these two to create a multilevel dendrogram.
Understanding our case as a multilevel dendrogram is crucial because it helps explain how two single-level dendrograms—one for categories and one for subcategories—can come together to form a more complex hierarchical structure. This is why we learned about the calculated fields in the first guide. Some fields are applied to one single-level dendrogram, while others are applied to another, depending on the hierarchical order of the dimensions.
Having clarity on these fields ensures you can apply them seamlessly regardless of the type of dendrogram you're building. Now that we have the structure in mind, let's move into creating the two single-level dendrograms, starting with subcategories.
Creating a Single-Level Dendrogram for Subcategories
Follow these steps to create a single-level dendrogram for subcategories:
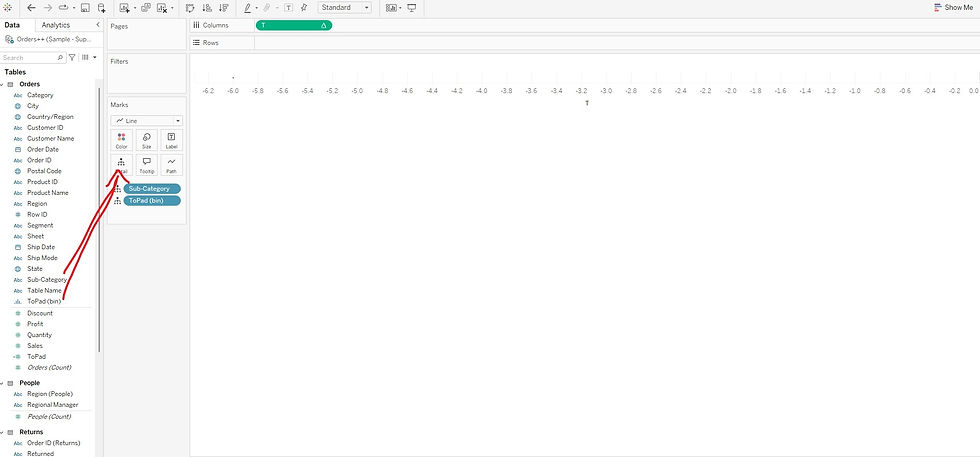
Change the chart type to Line:
This will allow us to visualize the dendrogram using curved lines.

Drag 'T' to the X-axis:
The T calculated field represents the values on the X-axis that help distribute the nodes.

Drag 'Subcategory' to Detail:
Each subcategory will be visualized as individual branches in the dendrogram.
Drag 'ToPad(bin)' to Detail:
The ToPad(bin) calculated field helps create smooth curves by adding multiple data points.

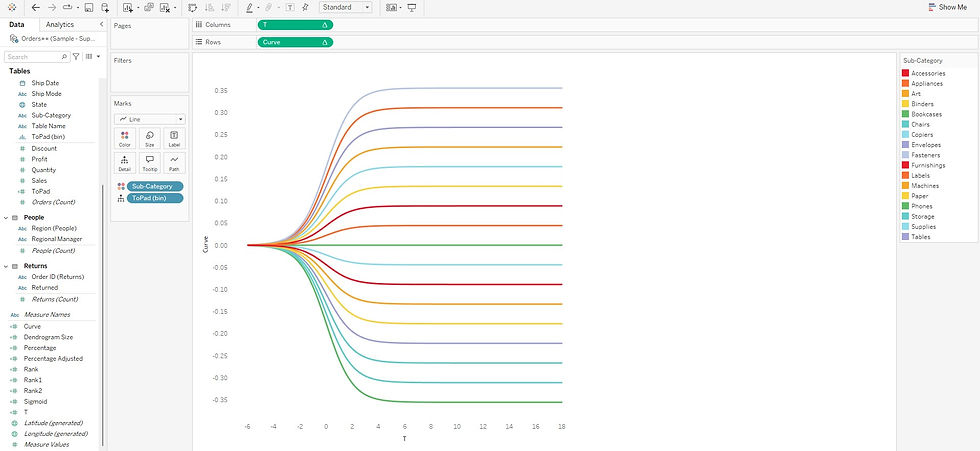
Drag 'Curve' to the Y-axis:
The Curve calculated field is responsible for the visual curvature of the dendrogram lines.

Right-click on the 'T' pill and choose 'Compute Using ToPad(bin)':
This tells Tableau to compute the distribution based on the ToPad(bin) values.

Right-click on the 'Curve' pill and choose 'Compute Using ToPad(bin)':
This ensures that the curve calculation is also done based on the ToPad(bin) values.

Right-Click on the Graph and click Format. Turn off all the lines.


Right-click on the 'Curve' pill again and choose 'Edit Calculation':
Curve Calculation:
Choose Subcategory alone under the nested Curve calculation.
Explanation: Selecting only Subcategory ensures that the curvature is drawn based on the individual subcategories.


Edit Rank Calculation:
Choose Subcategory alone under the Rank calculation (not Rank1).
Explanation: Selecting only Subcategory here ensures that each subcategory is ranked individually, which is crucial for correct branch positioning.

Add Color and Size:
Drag Subcategory into Colors and edit the colors as needed.

Drag Dendrogram Size into the Size shelf, then right-click and choose "Compute Using ToPad(bin)".


Edit Table Calculations:
Right-click and choose "Edit Table Calculations" for size.
Choose Rank2 and select Subcategory—bring it to the top.
Choose Percentage Adjusted and select Subcategory—bring it to the top.
Explanation: We use both ToPad and Subcategory for these options to ensure that size and percentage adjustments are calculated per subcategory and distributed smoothly.


Click Edit Axis and Reverse:
Reverse the Y-axis so that the dendrogram branches downward.


Hide Headers:
Hide unnecessary axis headers to enhance the visual appeal.

With these steps, your single-level dendrogram for subcategories is complete.
Creating a Single-Level Dendrogram for Categories
Creating a dendrogram for categories follows the exact same steps as for subcategories, with Categories replacing Subcategories in the process.
The same calculated fields will be applied here as well. Since the process is identical, I am not repeating each step here. However, I’ve shared a few screenshots below to help you compare and correlate between the subcategories and categories dendrograms.


You can easily duplicate the subcategories dendrogram sheet, replace Subcategory with Category, and resolve any errors in the calculated fields. Then, adjust colors and labels as needed. With both the subcategories and categories single-level dendrograms complete, we now have the foundational building blocks to move toward creating a multilevel dendrogram.
To merge both single-level dendrograms into a multilevel dendrogram, you'll need to bring them both into a dashboard and adjust the formatting to create a cohesive visual. However, before doing that, it's essential to group the subcategories based on their respective categories.
Start with the subcategories dendrogram sheet.

Drag 'Category' to Columns.

Drop down in the Category pill and select "Show Filter."

Select each category and assign colors using "Edit Colors" in the Marks section.


Remove the category filter.

Create a dashboard.

You'll notice nodes for categories and subcategories are different.
Adjust by dragging subcategories to ensure correct alignment with categories (Drag across subcategories - in the above screenshot, Technology should come up in the first).

Switch layout to floating, remove headers, labels, adjust alignment, and map both to form a multilevel dendrogram.


Happy Dendro Learning!
_edited_edited.png)