_edited_edited.png)


Power BI, stands for Power Business Intelligence, is a collection of software tools which let you import the data from various sources such as files (excel, text, csv, XML, JSON etc.), relational databases (SQL Server, MySQL etc.), web and turn it into meaningful insights to help make informed decisions.
In this blog I tried to lay out the step by step how to create a visual report
Step 1: Importing Data and Enhancing Data using Power Query Editor
Power BI lets you import raw data as is (if it’s cleansed and in desired format) or transform and clean in power query editor while importing the data.
If the data is cleansed and in a desired format click in Load depicted in below screenshot (a) to import the data as is,

(a)
If the data is not clean and may require some formatting changes then choose Transform Data option which navigates to open the Power Query editor, where you can work on your data to bring it in the way you want, as depicted in below screenshot (b).

(b)
In the Power Query editor, you can do many things to make your data ready for use:
Import Data: Bring in data from sources like files, databases, and websites.
Filter and Sort: Filer the data to pull in only required data, you can filter vertically (filter in/out rows) and/or horizontally (filter in/out columns) and sort it in the way you want.
Split and Merge Columns: Rearrange your data by splitting one column into several or combining multiple columns into one.
Clean and Transform: Lets you remove duplicates, replace values, and split text to clean up your data.
Group and Summarize: Create new columns or tables by grouping and summarizing data.
Combine Data: Merge data from different sources or tables by using merge and append functions.
These features help you prepare your data so you can analyze and visualize it effectively in Power BI.
Power Query Editor has many other options in ribbon located at the top which can be used to make changes in your dataset. As you make changes using these options, they are automatically applied, and you can see the updated data right away in your editor window
Step 2: Create Sub Table:
Once your data is imported, cleansed and transformed, now its time to slice and dice your data for your specific reporting, analysis and/or visualization needs by creating a sub table. Creating sub table does not impact your original dataset
Creating sub table:
Right click on main data and click on Reference to create sub table (as depicted in below screen shot (c))

(c)
Double click or right click and select Rename on a newly created sub table to rename it initiatively.
Remove unnecessary column:
Once sub table is created, next step is to remove columns those will not be needed. To do so, select the columns those are needed, right click on the header and click on the option remove columns from the dropdown list. Here we have another opportunity to do some cleanup, we can remove duplicates, merge the columns, replace values and/or remove errors. Now we will save this file. This file will be saved as .pbix, so that will can work on this dataset onwards. Review your changes and click on “close and apply” to apply the changes to your report.
Repeat the process to create another sub table if we want to any other dataset that need to be used in our report.
Step 3: Building Data Models
Next step is to define the relationships between sub tables we created in previous steps. If we had defined primary keys on each sub tables we created earlier, Power BI could have created the data models automatically.
Data modeling is foundation to create report in power BI. It enables you to connect different data tables in your Power BI report by establishing relationships between them.
A strong data model not only makes sure your data is accurate and consistent but also significantly boosts performance.
Then creating entity-relationship diagrams (ERDs) and make sense of how the data flows.
Entity-relationship diagrams (ERDs) are visual representations of schemas or entity-relationship models. You can use these to better understand how different tables relate to each other and get buy-in from analysts and end users.
There are three types of relationships between entities in different tables:
One-to-one (1:1):
A one-to-one relationship means both columns from both tables contain unique values. In other words, record in a table is associated with one and only one record in another table.
One-to-Many (1: ) OR Many-to-One(:1):
In “One-to-many” relationship, for every unique record in one table, there can be multiple related records in another table. This connection is made by linking a column in the first table that contains unique values (like customer IDs) to a matching column in the second table (such as order details), where Customer ID might appear more than once. This setup allows Power BI to effectively link and analyze data across different tables, making it easier to generate insightful reports and visualizations.
Many-to-Many (*: *):
In Power BI, a many-to-many relationship is used to connect two tables where both tables can have multiple instances of the same value. This type of relationship allows you to analyze data where there is no clear "one side" that uniquely defines the relationship. many to many relationships is very complex. They’re not commonly used, but can be useful for designing complex model requirements
Step 4: DAX Query View
DAX Query View is an editor which is used to write DAX functions or formula to custom data that we can subsequently use in our report to visualize the data.
It has many functions from basics to advanced to help with different types of data analysis, such as, SUM, AVERAGE COUNT, RELATED, CALCULATETABLE, and CROSSFILTER.
DAX is crucial in Power BI because it enables users to perform complex calculations and in-depth data analysis. With DAX, you can create measures and calculated columns to summarize and analyze data more efficiently and effectively. It also allows for complex calculations that go beyond what standard Excel functions can achieve.
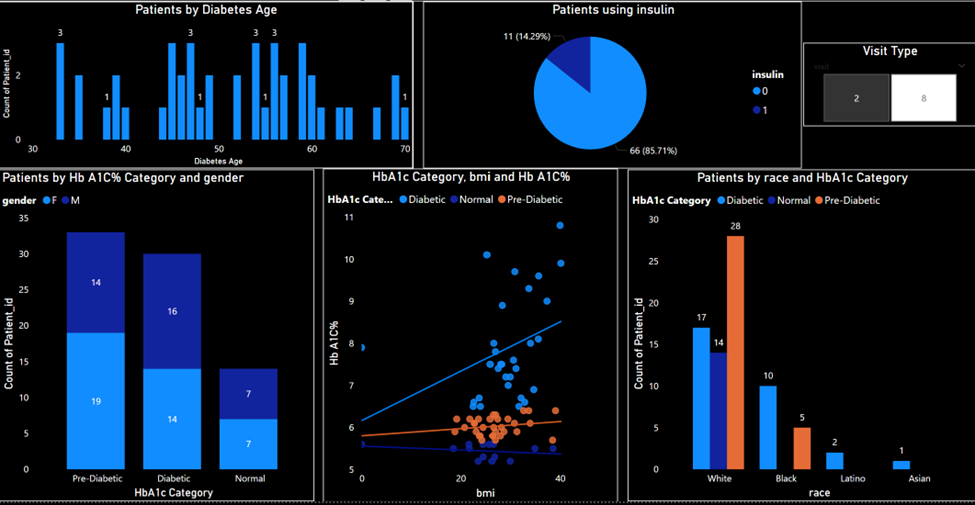
Step 5: Report View
Let’s move toward the report view (sometimes called as Visual Report). The Report view in Microsoft tools are eye-catching charts and graphs where data is sourced from data store using queries. You can arrange these visuals in way business stakeholders can read them easily and make informed decisions. That's why it's often called the Visual page.
In Power BI report view you can modify Filters data and fields, Visualizations. You can use these options on your report across all charts. This is also where we create Measures, Quick Measures and we can even create new columns.

Below is the example, how report can look like. This chart illustrates visuals, slicers, measures and columns added.
Conclusion:
Creating great data visuals in Power BI is about planning, using the tool’s features, understanding your data set, you can create effective report in power BI. By following these simple tips, you can make reports that are not only attractive but also provide valuable insights that help people make better decisions
Comments