Introduction
Python is widely used for data analysis due to its powerful libraries and ease of use. In this blog, we delve into an important and sensitive issue: suicide rates around the world. By analyzing data using Python, we aim to uncover patterns and insights that can help us better understand this global phenomenon and inform potential interventions.
Context
Every year, nearly 8,00,000 people die by suicide, which equates to one person every 40 seconds. Suicide affects people across all age groups and socioeconomic backgrounds. Effective, evidence-based interventions at the population, sub-population, and individual levels can prevent suicides and suicide attempts. It is estimated that for every adult who dies by suicide, there may be more than 20 others attempting suicide.
Objective
The primary objective of this analysis is to identify patterns in suicide rates across different cohorts globally, considering various socioeconomic factors using exploratory data analysis (EDA).
Data Description
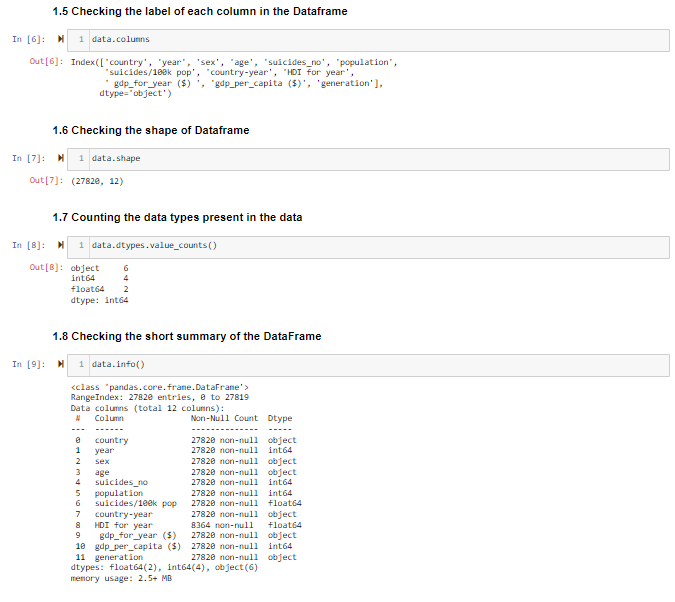
We will be using a dataset that records suicide rates from 1985 to 2016. The dataset includes the following attributes:
Country: The name of the country.
Year: The year of the record.
Sex: The gender of individuals (male or female).
Age: The age range of individuals, categorized into six groups.
Suicides Number: The number of suicides recorded.
Population: The population of the specific gender and age group in that country and year.
Suicides per 100k Population: The number of suicides per 100,000 people.
GDP for Year ($): The GDP of the country for that year in dollars.
GDP per Capita ($): The GDP per capita, calculated as the GDP of the country divided by its population.
Generation: The generation of individuals, divided into six categories.
Data Source
The dataset can be found on Kaggle here .
Key Questions to Explore
Age Categories: Is the suicide rate more prominent in certain age categories?
Country Comparisons: Which countries have the highest and lowest number of suicides?
Population Impact: How does population size affect suicide rates?
Economic Factors: What is the influence of a country's GDP on suicide rates?
Trends Over Time: What trends in suicide rates can be observed over the years?
Gender Differences: Are there significant differences between the suicide rates of men and women?
Exploratory Data Analysis
The analysis begins with loading the necessary libraries and the dataset. The initial inspection of the dataset includes checking for missing values and data types. The dataset is then cleaned and prepared for further analysis.
Data Visualization
Lets visualize the data based on the analysis.
Distribution of Suicides by Age, Gender, Country
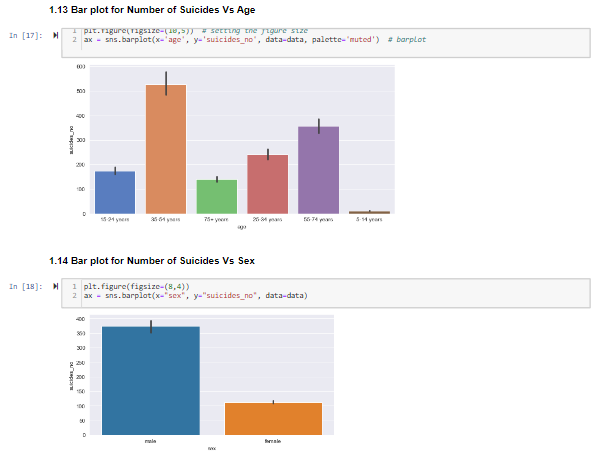
The above graphs shows that Russia has the highest number of suicides, followed by the United States and Japan. Additionally, there are higher numbers of suicides among middle-aged individuals compared to younger and older age groups, with males committing suicide at significantly higher rates than females.
Impact of GDP on Suicide Rate

As shown in the plot, there is a weak negative correlation between GDP per capita and suicide rates, indicating that higher economic prosperity might be associated with lower suicide rates, but the relationship is not very strong.
Correlation Analysis: Examining Relationships Among Continuous Variables

The heatmap above illustrates the correlation among various continuous variables within the dataset. This analysis helps to identify the strength and direction of relationships between pairs of variables. Key observations include a strong positive correlation between GDP per capita and HDI for the year (0.8), indicating that higher economic prosperity is associated with better human development indices. Additionally, there is a notable correlation between population and the number of suicides (0.5), suggesting that countries with larger populations tend to report higher numbers of suicides. Understanding these correlations is crucial for pinpointing factors that may influence suicide rates and for developing targeted interventions.
Suicides Based on Generation and Gender
The analysis shows that suicides among males not only occur at higher rates but also exhibit a slight variation in distribution across generations compared to females. Suicides are particularly high among both male and female Boomers. Additionally, Japan stands out for having a larger proportion of female suicides compared to other countries with high suicide rates.
Number of Suicides Across Generations

The graph illustrates the average number of suicides along with their confidence intervals. It reveals that suicides among females generally show little fluctuation. Additionally, the average number of suicides in Gen-Z is nearly equal across genders, indicating a more balanced distribution in this age group.
Trends Over Time

The trend plot above shows the pattern of suicides per 100,000 population from 1985 to 2015. The data indicates a noticeable increase in the suicide rate starting from the mid-1980s, peaking around the late 1990s to early 2000s. After this peak, there is a gradual decline in the suicide rate, which continues until 2015.
This trend analysis highlights significant changes in suicide rates over three decades. The peak in the late 1990s may be attributed to various global socioeconomic factors, while the subsequent decline could reflect improvements in mental health awareness, economic conditions, and intervention strategies.
Understanding these patterns is crucial for developing effective policies and preventive measures to address the factors influencing suicide rates.
Conclusion
This analysis provides a comprehensive overview of global suicide rates and the various factors influencing them. By identifying patterns and trends, we can better understand the complexities of this issue and work towards effective prevention strategies. Python, with its robust data analysis libraries, proves to be an invaluable tool in uncovering these insights.
To share the insights and detailed findings, you can access the PDF version of the analysis
_edited_edited.png)


