This blog explains the advance level of dendrogram. If you are a beginner regarding dendrogram, I would suggest you to read my previous blog for better understanding as I would be jumping directly into designing the multilevel diagram.
Link for designing single level dendrogram -DENDROGRAM - A Data Visualization Tree Chart
Multilevel Dendrogram -
Dendrogram is basically a tree diagram. If it has one node division then it is called single level dendrogram and if there is a multiple branch, that is two or more node divisions then it is called Multilevel dendrogram. Multilevel is used to define the connection between group- subgroups. This type of chart is famous for depicting hierarchical clustering.
The basic goal of this blog is to get the tree diagram with 2 divisions. Here for example we are going to use the Sepsis dataset . And, we are going to explore how many sepsis patients also have Acute Respiratory Distress Syndrome (ARDS).

Before we jump into creating dendrograms, let's understand what Sepsis and ARDS as we will be using the terms often.
Sepsis:
According to the Centers for Disease Control and Prevention, Sepsis is a life threatening emergency situation where the body reacts to infection in an extreme manner. It is imperative for everyone to know about the sepsis condition as most of the patients have sepsis before they seek medical attention.And about 1 in 3 people die during hospitalization.
ARDS : Acute Respiratory Distress Syndrome
ARDS is acute lung injury. It could be one of the complications of sepsis. It's a serious lung condition that causes low blood oxygen. Acute lung injury has a high mortality rate and a high under diagnosing rate. Hence, early diagnosis will help to treat the patients promptly and prevent lung failure.
Now, let's delve into the needed steps to create a multilevel dendrogram
Create a union in the dataset to create Path bins
Create necessary calculated fields
Separately design a single level dendrogram for sepsis category and
Another single level dendrogram for the ARDS subgroup
Establish a connection between them by creating parameters
Implement the parameters in Dashboard actions, facilitating their connection .
Enabling seamless interaction.
Steps 1, 2 and 3 are already covered in the blog "DENDROGRAM - A Data Visualization Tree Chart". Please refer back and do the necessary steps to create a single level dendrogram for sepsis category and ARDS sub category.
Single level dendrogram for the Sepsis category should appear like below.

#4. Another single level dendrogram for the ARDS subgroup
Creating single level dendrogram for ARDS using already created calculated fields for sepsis dendrogram
We have to follow the same steps as we followed for Sepsis dendrogram, with the only difference being the use of ARDS classification variable (ARDS classification has classified patients into mild, moderate and severe ARDS) instead of the Sepsis classification.
The resulting ARDS dendrogram should resemble the picture below.
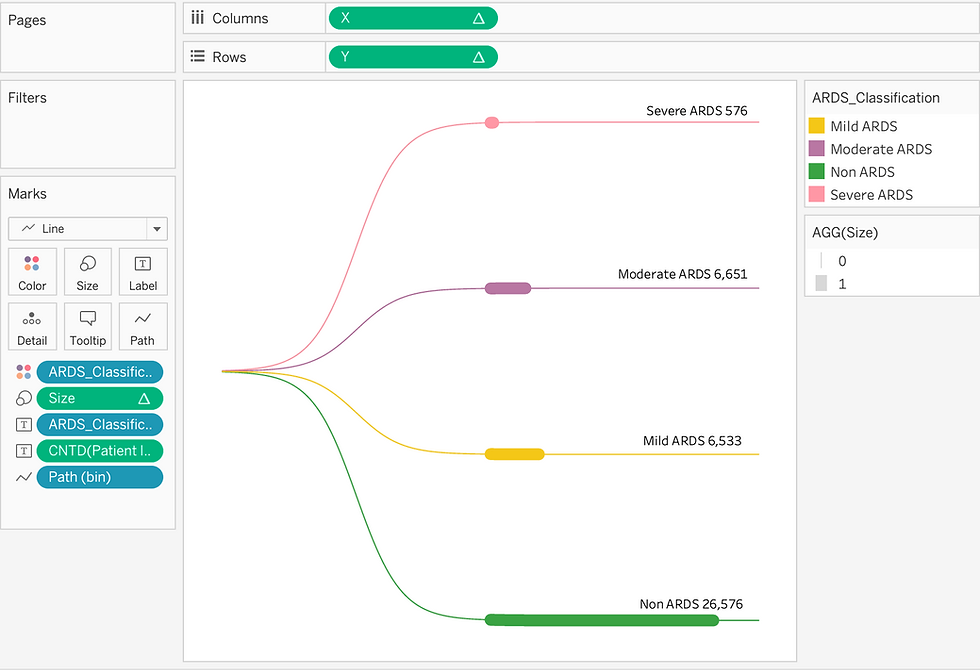


From the above ARDS dendrogram and the ARDS classification table, we can see that this dendrogram represents all ARDS patients in the dataset, not as a subgroup of Sepsis condition.
We need to design the ARDS dendrogram to function as a subgroup of the Sepsis condition category. This way, we can determine how many Sepsis patients also have an ARDS condition. Our goal is to create a dendrogram chart that reflects the data in the table below.

#5. Establish a connection between them by creating parameters
In order to achieve the results - we have to create parameters in tableau to connect the Sepsis and ARDS classification variables.
Lets name the parameter as 'Sepsis parameter'.
To create one, locate the 'Sepsis classification' variable in the Data pane and right click on it.
From the drop down menu go to 'Create' and select 'Parameter'. A 'Create Parameter' box will open with pre-filled details.
Now, rename it as Sepsis parameter and click ok


Next step is to implement this parameter to create a link between ARDS and Sepsis.
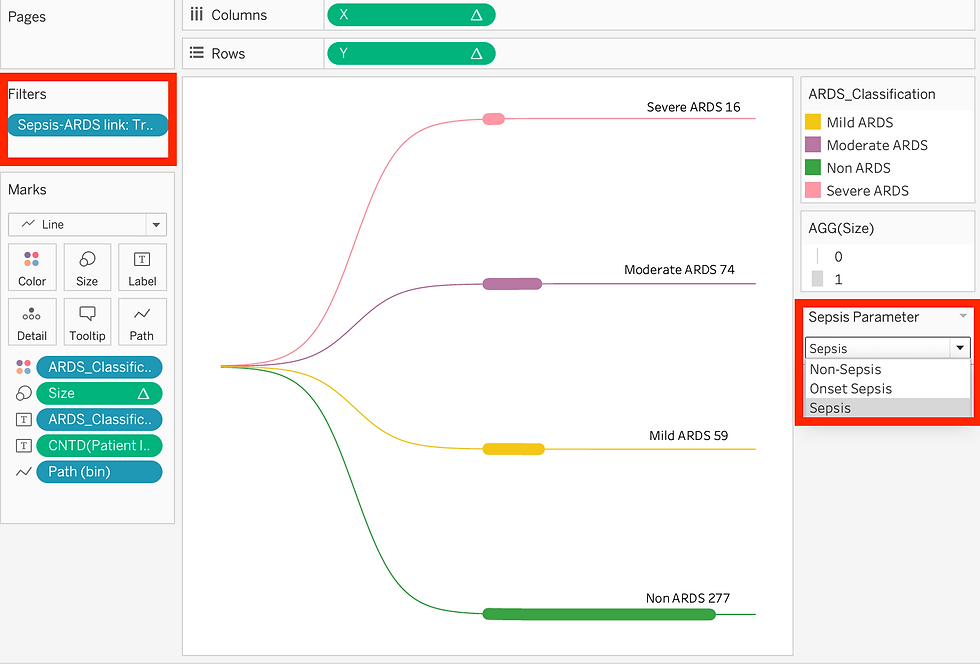
Create a calculated field and name it ' Sepsis-ARDS link'
formula used: [Sepsis_classification]= [Sepsis Parameter]
This is basically a boolean expression- Now drag and drop the 'Sepsis-ARDS link' variable into the 'Filters' shelf .
In the filter option check True box and click OK.
Here by creating this variable and using it in filters, we are filtering only the category branch that we want and applying it to the ARDS , which in turn allows you to visualize ARDS as a subset of the sepsis condition.


Now, find the 'Sepsis Parameter' and right click on it and select show parameter.
Sepsis Parameter will appear on the right side of the worksheet.
Click on the drop down menu and select any Sepsis condition category you are interested in
Notice that the ARDS dendrogram updates based on the selected Sepsis condition, acting as a subgroup of that condition. Here in the below pic- I have selected the 'Sepsis ' category in Sepsis classification.

Worksheets with single level dendrograms are ready! Lets now proceed to arrange them to make it an interactive multilevel dendrogram.
#6 Implement the parameters in Dashboard actions, facilitating their connection.
Let's get the worksheets arranged in a dashboard. In the below video, we can see that the ARDS updates only when we use the parameter, not clicking directly on to the Sepsis branches. Hence, the next few steps will explain how to connect the end node of the sepsis condition branches to the beginning node of ARDS subgroup.

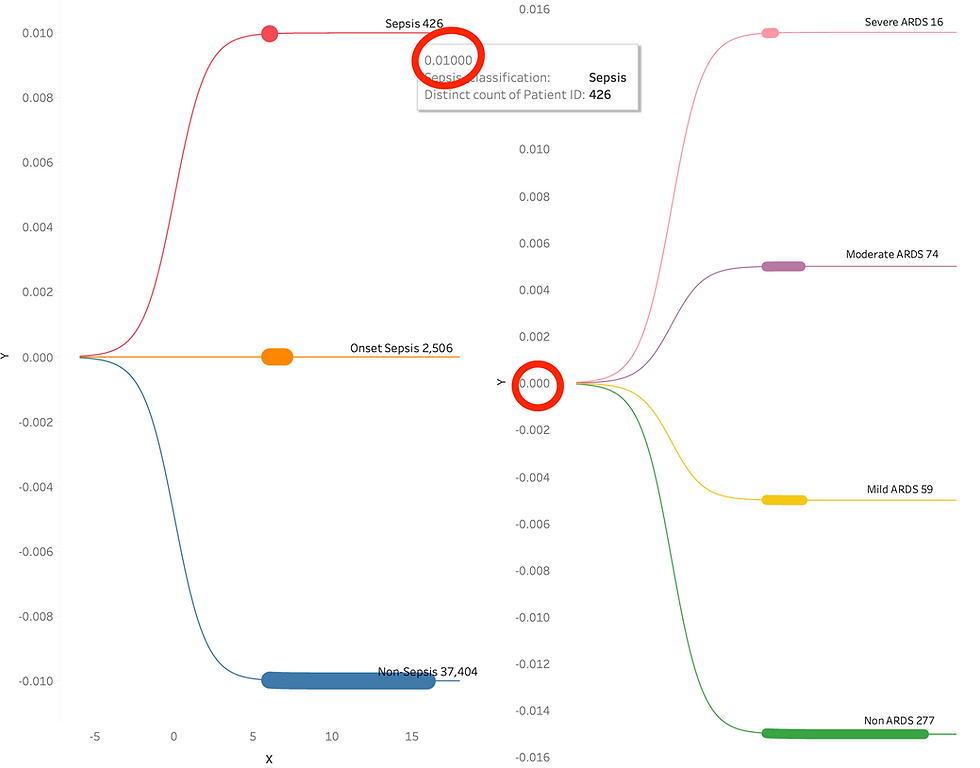
Here in the picture, we could see that the sepsis dendrogram branch is at Y coordinate 0.010 and ARDS subgroup's beginning point is in Y coordinate 0.000.
Lets create a Y axis parameter which can indicate the ARDS subgroup dendrogram to move to the same Y axis coordinate as the sepsis dendrogram' Y axis coordinate. Hence, when we juxtapose the sheets side by side in the dashboard, we will be able to see the connections aligned perfectly.
For Y axis parameter,

Click on the drop down menu near search bar in the 'Data' pane and select 'Create Parameter'.
Then change the current value from 1 to 0
Rename as Y axis parameter and click OK
Let's incorporate this Y axis parameter into the 'Y' variable we created. The 'Y axis parameter' should be added only to the Y variable of the ARDS subgroup, since we want only ARDS to update and move according to the Sepsis branches. The following steps should be done to adapt to the changes.
Go to the ARDS dendrogram worksheet
Then find the 'Y' variable in the 'Data' pane and right click on it and select 'Duplicate'
'Y(copy)' variable will appear. Right click on it and rename it to 'Y ARDS'
Again right click on it and select 'Edit' option
Now, just add the 'Y axis parameter' to the existing formula and click OK

After creating the 'Y ARDS', replace the 'Y' variable in the Rows shelf with 'Y ARDS'
The dendrogram will disappear because of the change, do not panic :) (because I panicked when I did this for the first time )
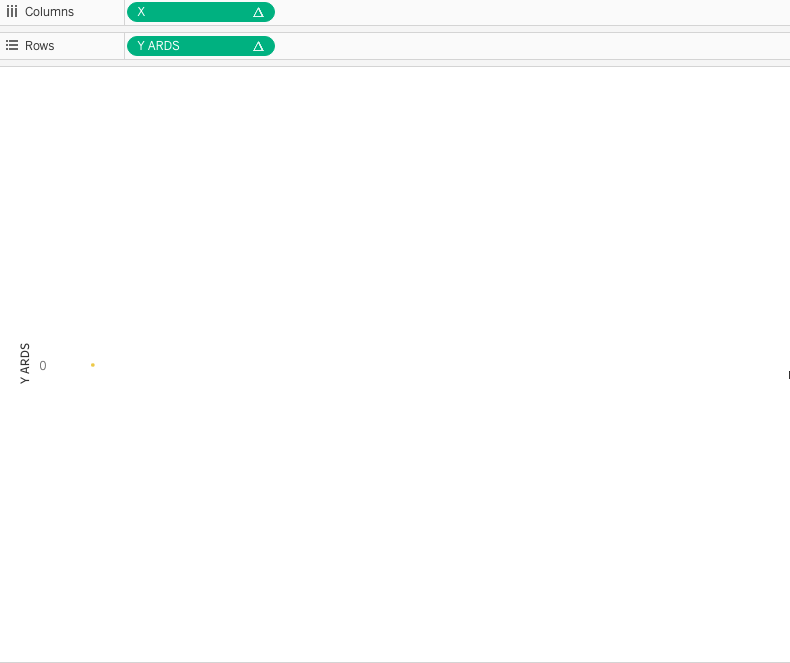
Now, let's reconfigure the settings in 'Compute Using' and 'Edit Table Calculation'
Right click on the 'Y ARDS' variable in the row shelf and go to 'Compute Using' and select 'Path (bin)'
Then again right click on the 'Y ARDS' and select 'Edit table Calculation'
In the Nested calculations, go to 'Y ARDS' and select 'Specific Dimensions' in 'Compute Using' and check both 'ARDS classification' and 'Path (bin)
Likewise, In the Nested calculations, go to 'Rank' and select 'Specific Dimensions' in 'Compute Using' and check 'ARDS classification' only
The ARDS dendrogram will reappear.


Now, let's put everything into action by using 'Actions' in Dashboard. We will be creating 2 actions.
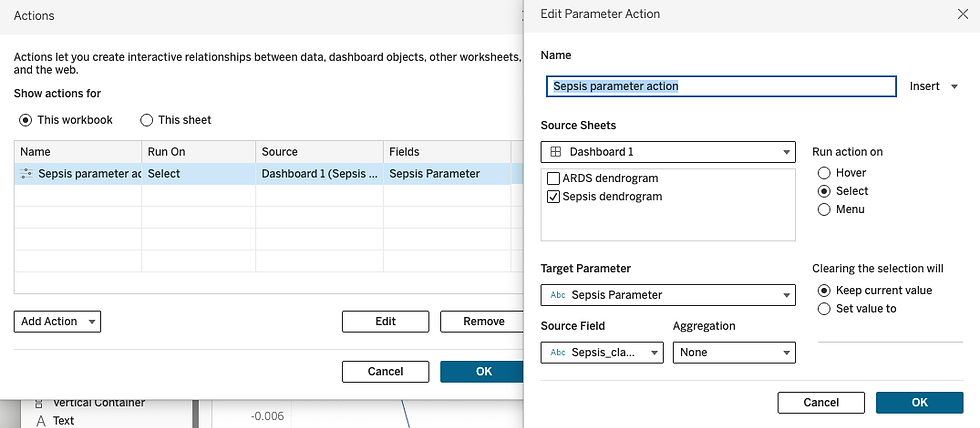
First one is Sepsis parameter action - to connect the 'Sepsis parameter' and the 'Sepsis classification' variables
In the main menu, click on 'Dashboard' and select 'Actions'
An Actions box will open, in the box click on 'Add Action'
From the pop up menu select 'Change Parameter' to add a parameter action
Rename it as Sepsis parameter action
In the 'Source Sheets' select 'Sepsis dendrogram' (worksheet name where you have created the sepsis dendrogram)
Select the 'Target Parameter' as 'Sepsis parameter' from the options shown in the drop down menu.
Select the 'Source Field' as 'Sepsis classification' from the options shown in the drop down menu.
Click OK
The 'Sepsis parameter action' will be added in the 'Action' box.
2. Let's create another action for connecting the 'Y axis parameter' to the 'Y' variable that's used in Sepsis dendrogram.
Click on 'Add Action and select 'Change Parameter'
Rename the action as 'Y axis parameter action'
In the 'Source Sheets' select 'Sepsis dendrogram' (worksheet name where you have created the sepsis dendrogram)
Select the 'Target Parameter' as 'Y axis parameter' from the options shown in the drop down menu.
Select the 'Source Field' as 'Y ' from the options shown in the drop down menu.
Click 'OK'
The 'Y axis parameter action' will be added in the 'Action' box.
Then, Click 'OK' in the 'Actions' box

What basically we have done here is that we have connected the Sepsis Dendrogram to the parameters that we created in order to make ARDS as a subgroup of Sepsis condition . This includes the 'Y axis parameter' that we added in 'Y ARDS' and 'Sepsis parameter' that we used as a filter in ARDS dendrogram.
As a result, when we click on Sepsis dendrogram's branches, the ARDS dendrogram will update accordingly.
In the below looped video, please notice that when one of the sepsis condition branches is selected, the ARDS dendrograms starting node's Y coordinates match the sepsis branch's Y coordinate and as well, ARDS acting as a subgroup of Sepsis condition.

#7 Enabling seamless interaction.
We are almost there! Finally, we have to do one adjustment in the Y axis of both the worksheets for a seamless interaction.
First, Right click on Y axis of the Sepsis dendrogram and select 'Edit Axis'
In the 'Range' select 'Custom' option and change the fixed start and fixed end values to -0.062 and + 0.062 respectively. (0.062 value is a pre-calculated value that works best for the connection)
Then close the pop up 'Edit Axis box'
Repeat the same steps for Y axis of ARDS dendrogram


Now, change the background color of both the dendrogram worksheets to 'None' and change them to floating mode in the dashboard and hide the Y axis headers. So, they can be overlapped to create a seamless interaction.
Overlap the worksheets to match the end node of sepsis dendrogram and beginning node of ARDS dendrogram to get the desired interaction.

TADA !!! Our interactive multilevel dendrogram is ready!
Let's look at our final dashboard after a few beautification steps.
Dashboard : SEPSIS - ACUTE RESPIRATORY DISTRESS SYNDROME

In conclusion, multilevel dendrogram visually treats the viewer to understand the relationship between category and sub category at a granular level , enhancing the ability to analyze the complex relationship.
Even though the steps look complex, it's actually easy once you understand the concepts.
I hope this blog helped you to understand the basics of the dendrogram concepts. Do post your comments and like this page or give a clap if you found this blog helpful. Thanks for stopping by! Meet you all in my next blog!
Happy Creating!
[If u want to know about another type of dendrogram- holistic approach like below pic, let me know in comments

]
_edited_edited.png)