Models use machine learning algorithms, in which the machine learns from the data just like humans learn from their experiences. Here, I will explain linear Regression, one of the machine learning algorithms. After reading this, we will get some basic knowledge about linear Regression, its uses, and its types.
Regression analysis is a form of predictive modeling technique that investigates the relationship between X and Y, where X is the independent variable and Y is the dependent variable. There are two types of Regression. One is linear Regression used with continuous variables, and the other is logistic Regression used with categorical variables.
Linear Regression
Regression shows the changes in a dependent variable on the y-axis to the changes in the independent variable on the x-axis.
Linear Regression uses
Evaluating trends and sales estimates
Analyzing the impact of price changes
Estimation of risk in the financial services and insurance domain
Types of Linear Regression
Linear Regression is of two types. One is positive Linear Regression, and the other is negative Linear Regression.
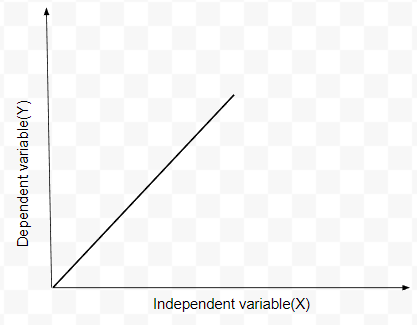
Positive Linear Regression– If the value of the dependent variable increases with the increase of the independent variable, then the slope of the graph is positive; such Regression is said to be Positive Linear Regression.

y=mx+c, where m is the slope of the line. In Positive Linear Regression, the value of m is positive.
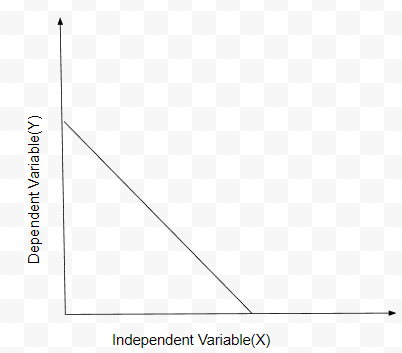
Negative Linear Regression- If the value of the dependent variable decreases with the increase in the value of the independent variable, then such Regression is said to be negative linear Regression.
In Negative Linear Regression, the value of m is Negative.

Finding the best fit line:
For different values of m, we need to calculate the line equation, where y=mx+c as the value of m changes, the equation changes. After every iteration, the predicted value changes according to the line’s equation. It needs to compare with the actual value and the importance of m for which the minimum difference gives the best fit line.
Let’s check the goodness of fit:
To test how good our model is performing, we have a method called the R Square method
R square method
This method is based on a value called the R-Squared value. It measures how close the data is to the regression line—and is also known as the coefficient of determination.

To check our model’s good, we need to compare the distance between the actual value and mean versus the distance between the predicted value and mean. If the value of R2 is nearer to 1, then the model is more effective
If the value of R2 is far away from 1, then the model is the least effective. This means that the data points are far away from the regression line. If the value of R is 1, then the actual data points would be on the regression line.
Conclusion
We have covered some topics related to Linear Regression. And we also found the effectiveness of the model using the R square method. For example, R-value might come close to 1 if the data is regarding a company’s sales. R-value might be too low if the information is from a doctor in psychology since different persons have different characters. So the conclusion is if the R-value is closer to one, the more accurate the predicted value is.
_edited_edited.png)