Python’s ecosystem of libraries provides unparalleled tools for developers, data scientists, and analysts. During a Python hackathon, I discovered several important Python libraries, some of which were new to me. This experience not only broadened my knowledge but also underscored the importance of these tools in efficiently solving real-world problems. In this blog, we’ll explore how to leverage the capabilities of several versatile Python libraries, focusing on data manipulation, visualization, and analysis. Here’s an in-depth look at these libraries and their practical applications:
Data Manipulation and Analysis Libraries
1. NumPy
NumPy is essential for numerical computations and provides the backbone for data analysis workflows.
Use Case: Creating multi-dimensional arrays and performing mathematical operations.
Explanation: This example demonstrates performing a matrix multiplication using the np.dot function.
import numpy as np  # Import the NumPy library

# Define two 2D arrays
array1 = [[1, 2, 3], [4, 1, 3], [4, 11, 8]]
array2 = [[4, 11, 8], [2, 3, 9], [4, 11, 8]]

# Perform matrix multiplication
result_array = np.dot(array1, array2)

# Print the resulting array
print("Answer:", result_array)
Output:

2. Pandas
Pandas simplifies data manipulation and analysis with its DataFrame structure.
Use Case: Loading, cleaning, and transforming datasets.
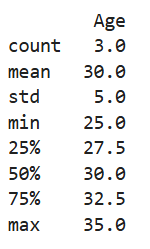
Explanation: This example demonstrates creating a DataFrame and using the describe method to generate summary statistics for the dataset.
import pandas as pd  # Import pandas for data manipulation

# Create a DataFrame with sample data
data = pd.DataFrame({
    'Name': ['Alice', 'Bob', 'Charlie'],
    'Age': [25, 30, 35]
})

# Use the describe method to generate summary statistics
print(data.describe())
Output:
3. SQLAlchemy
SQLAlchemy is a powerful SQL toolkit and ORM for Python. Note: To use SQLAlchemy with PostgreSQL, you need to install the psycopg2 library. Install it using:
pip install psycopg2-binaryUse Case: Managing database connections and executing queries.
Explanation: The following code demonstrates connecting to a SQLite database, creating a table, inserting data, and querying the database.
Explanation: The following code demonstrates connecting to a PostgreSQL database, creating a table, inserting data, and querying the database.
from sqlalchemy import create_engine, Column, Integer, String, MetaData, Table  # Import necessary modules

# Create a PostgreSQL database connection (replace placeholders with your credentials)
engine = create_engine('postgresql://yourusername:yourpassword@localhost:5432/yourdatabase')

# Define metadata and a sample table
metadata = MetaData()
users = Table(
    'users', metadata,
    Column('id', Integer, primary_key=True),  # Define a primary key column
    Column('name', String),  # Define a name column
    Column('age', Integer)  # Define an age column
)

# Create the table in the database
metadata.create_all(engine)

# Insert data into the table
with engine.begin() as connection:
    connection.execute(users.insert(), [
        {'name': 'Alice', 'age': 25},
        {'name': 'Bob', 'age': 30}
    ])

# Query the data and print the results
with engine.connect() as connection:
    result = connection.execute(users.select())  # Select all rows from the table
    for row in result:
        print(row)  # Print each row
Output:

Data Visualization Libraries
4. Matplotlib
Matplotlib is the go-to library for crafting detailed and customizable plots.
Use Case: Visualizing trends and distributions.
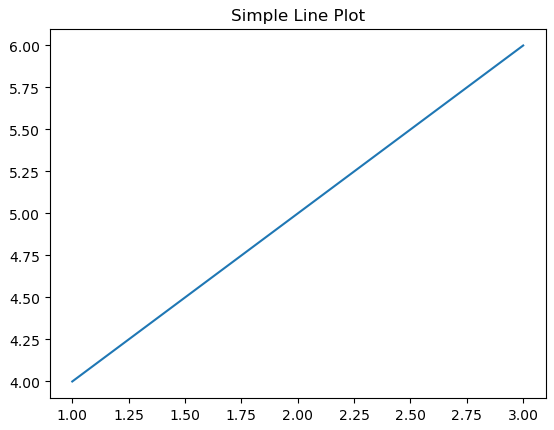
Explanation: The code plots a simple line chart with a title.
import matplotlib.pyplot as plt  # Import the pyplot module from Matplotlib
plt.plot([1, 2, 3], [4, 5, 6])  # Plot a line connecting points (1, 4), (2, 5), (3, 6)
plt.title("Simple Line Plot")  # Add a title to the plot
plt.show()  # Display the plot
Output:
5. Seaborn
Seaborn enhances Matplotlib with high-level statistical visualization capabilities.
Use Case: Creating aesthetically pleasing and informative plots.
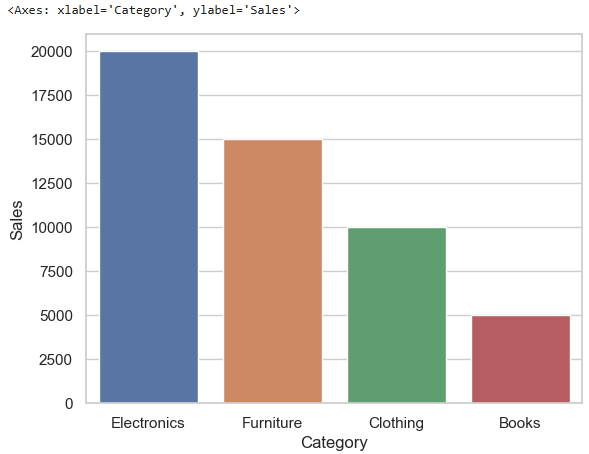
Explanation: This example demonstrates a bar plot using a custom dataset to compare average monthly sales for different product categories.
import seaborn as sns  # Import the Seaborn library
import pandas as pd  # Import pandas for data manipulation

# Create a custom dataset
data = pd.DataFrame({
    "Category": ["Electronics", "Furniture", "Clothing", "Books"],
    "Sales": [20000, 15000, 10000, 5000]
})

sns.set_theme(style="whitegrid")  # Set a white grid theme for the plots
sns.barplot(x="Category", y="Sales", data=data)  # Create a bar plot of sales by category
Output:
6. Missingno
Missingno provides easy visualizations to identify and handle missing data.
Use Case: Spotting and addressing missing values in datasets.
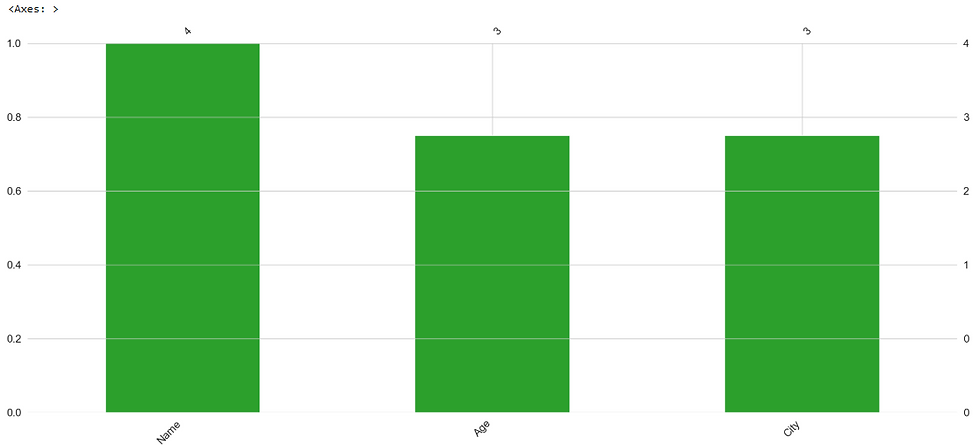
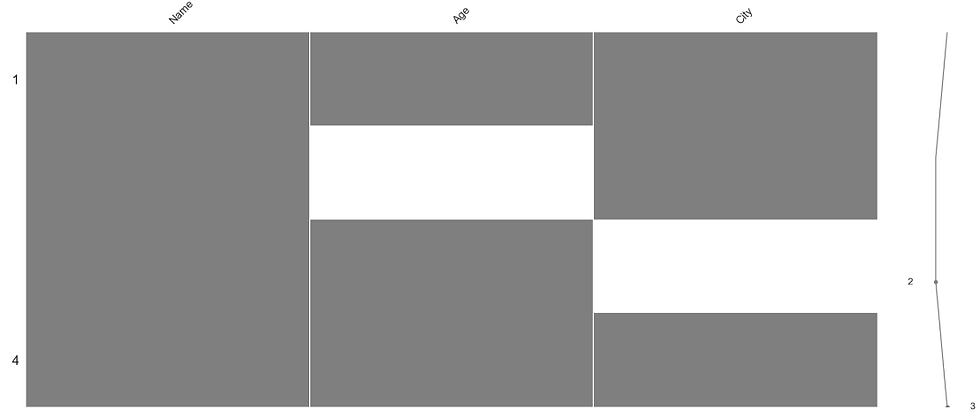
Explanation: The code visualizes the missing data in a given DataFrame.
import missingno as msno  # Import the missingno library
import pandas as pd  # Import pandas for data manipulation

# Create a sample dataset with missing values
data = pd.DataFrame({
    "Name": ["Alice", "Bob", "Charlie", "David"],
    "Age": [25, None, 30, 22],  # Age column with a missing value
    "City": ["New York", "Los Angeles", None, "Chicago"]  # City column with a missing value
})

msno.bar(data)  # Generate a bar plot showing count of missing values per column.
msno.matrix(data) #The matrix plot displays the pattern and location of missing values, white spaces represents data absence along rows.
Output:
7. PyWaffle
PyWaffle is perfect for creating unique waffle charts. Note: To use PyWaffle with PostgreSQL, you need to install the PyWaffle library. Install it using:
pip install pywaffleUse Case: Visualizing proportions effectively.
Explanation: The code creates a waffle chart showing the distribution of programming language usage.
from pywaffle import Waffle  # Import the Waffle chart module
import matplotlib.pyplot as plt  # Import pyplot from Matplotlib
fig = plt.figure(
    FigureClass=Waffle,  # Specify the Waffle chart class
    rows=5,  # Define the number of rows in the chart
    values={"Python": 50, "R": 30, "Others": 20},# Specify the proportions
    title={"label": "Programming Language Usage", "loc": "center"}  # Add a centered title
)
plt.show()  # Display the waffle chart
Output:

8. Plotly
Plotly is a robust library for interactive and dynamic visualizations. Plotly supports various types of plots like line charts, scatter plots, histograms, box plots, pie chart , violin chart etc. Note: To use Plotly with PostgreSQL, you need to install the Plotly library. Install it using:
pip install plotlyUse Case: Creating dashboards and advanced plots.
Explanation: This example demonstrates how to create a violin chart along with box plots and scatter plot to show the distribution of student grades across different classes.
import plotly.express as px  # Import Plotly Express
import pandas as pd  # Import pandas for data manipulation

# Sample dataset
data = {
    "Class": ["A", "A", "A", "B", "B", "B", "C", "C", "C"],
    "Grade": [85, 90, 65, 75, 80, 60, 95, 85, 70]
}
df = pd.DataFrame(data)

# create box and scatter plot along with violin plot
fig = px.violin(df, y="Grade", x="Class", box=True, points="all", title="Grade Distribution by Class")
fig.show()
Output:

Statistical and Scientific Libraries
9. SciPy
SciPy provides tools for scientific computing, including statistics, optimization, and signal processing.
Use Case: Performing advanced statistical tests.
Explanation: This example calculates the Spearman correlation coefficient between two variables.
from scipy.stats import spearmanr  # Import the Spearman correlation function
import numpy as np  # Import NumPy for numerical operations

# Define two variables
x = np.array([1, 2, 3, 4, 5])
y = np.array([5, 6, 7, 8, 7])

# Calculate the Spearman correlation
correlation, p_value = spearmanr(x, y)
print(f"Spearman correlation: {correlation}, P-value: {p_value}")
Output:

10. Scikit-learn
Scikit-learn is one of the most popular libraries for machine learning in Python, offering tools for classification, regression, clustering, and preprocessing tasks.
Use Case: Encoding categorical data for machine learning models.
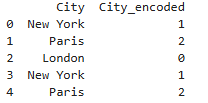
Explanation: This example demonstrates how to use the LabelEncoder to transform categorical labels into numerical values.
from sklearn.preprocessing import LabelEncoder  # Import the LabelEncoder class
import pandas as pd  # Import pandas for data manipulation

# Sample dataset
data = pd.DataFrame({
    'City': ['New York', 'Paris', 'London', 'New York', 'Paris']
})

# Initialize the LabelEncoder
encoder = LabelEncoder()

# Apply the encoder to the 'City' column. The fit_transform method assigns a unique integer to each unique category
data['City_encoded'] = encoder.fit_transform(data['City'])

print(data)  # Print the DataFrame with the encoded column
Output:
Utility Libraries
11. Datetime
The datetime module in Python provides classes for working with dates, times, and time-related operations.
Use Case: Manipulating and formatting dates and calculating time differences.
Explanation: This example demonstrates how to create dates, format them, and calculate the difference between two dates.
from datetime import datetime, timedelta  # Import datetime and timedelta classes

# Create a specific date
start_date = datetime(2023, 1, 1)

# Add 10 days to the date using timedelta
future_date = start_date + timedelta(days=10)

# Format the date as a string
formatted_date = start_date.strftime("%B %d, %Y")

# Calculate the difference between two dates
today = datetime.now()
date_difference = today - start_date

print(f"Start Date: {formatted_date}")
print(f"Future Date: {future_date.strftime('%B %d, %Y')}")
print(f"Today's Date:{today.strftime('%B %d, %Y')}")
print(f"Difference between today's date and start date: {date_difference.days} days")
Output:

12. Regular Expressions (re)
The re module in Python is used for working with regular expressions, a powerful tool for searching, matching, and manipulating strings based on patterns.
Use Case: Validating and extracting information from strings.
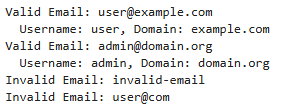
Explanation: This example demonstrates validating an email address format and extracting the username and domain.
^[a-zA-Z0-9._%+-]+: Starts with alphanumeric characters and may include special characters (._%+-).
@[a-zA-Z0-9.-]+: Contains an @ symbol followed by a domain name with alphanumeric characters and periods.
\.[a-zA-Z]{2,}$: Ends with a dot and a domain suffix (e.g., .com, .org) of at least two characters.
import re  # Import the re module

# Define a regular expression for validating email addresses
email_pattern = r'^[a-zA-Z0-9._%+-]+@[a-zA-Z0-9.-]+\.[a-zA-Z]{2,}$'

# Sample email addresses
emails = ["user@example.com", "admin@domain.org", "invalid-email", "user@com"]

# Loop through each email and validate
for email in emails:
    if re.match(email_pattern, email):  # Check if the email matches the pattern
        print(f"Valid Email: {email}")

        # Extract username and domain
        username, domain = email.split("@")
        print(f"  Username: {username}, Domain: {domain}")
    else:
        print(f"Invalid Email: {email}")
Output:
13. Random
The random module facilitates random number generation for simulations and data sampling.
Use Case: Generating random samples.
Explanation: This example demonstrates creating a random sample from a range of numbers.
import random  # Import the random module

# Generate a random sample of size 5 from a range of 1 to 50
sample = random.sample(range(1, 51), 5)
print("Random sample:", sample)
Output:

Conclusion
These Python libraries are the backbone of data science, offering robust functionalities for data manipulation, visualization, and computation. Each library has unique features tailored for different tasks, and mastering them will enhance your data science toolkit. My Python hackathon experience opened my eyes to many of these tools, and I hope this blog inspires you to explore them in your projects!
_edited_edited.png)