_edited_edited.png)
Linear regression is the one of the most known and understood algorithms in statistics and machine learning.
What is a linear regression algorithm?
Linear regression algorithm is supervised machine learning technique where predicted output is continuous and has constant slope. It is used to predict values within a continuous range rather than trying to classify them into categories. There are two main types of linear regression : 1. simple linear regression and 2. multivariable regression.
Today we are gonna discuss only simple linear regression here.
What is Simple linear regression?
Simple linear regression is a way to model a relationship between two sets of data. In layman language it models the relationship between independent variable and dependent variable.
It is a line graph with X-axis and Y- axis. The x-variable is called an independent variable and the y- variable is called dependent variable. Technically in regression, the independent variable is called the predictor variable and the dependent variable is called criterion variable. A linear regression is where the relationship between two variables can be described with a straight line.
The result is a linear regression equation which is used to predict data.
The formula for simple linear regression is:

Where,
y is the predicted value of the dependent variable y for given value of independent variable value x
B0 is the intercept, the predicted value of y when x is 0
B1 is the regression coefficient - how much we expect y to change as x changes
x is the independent variable
e is the error of the estimate or how much variation there in our estimate of the regression coefficient.
Linear regression finds the best fit line through the data searching for the regression coefficient that minimizes the total error of the model.
Let's see one example for Simple linear regression.

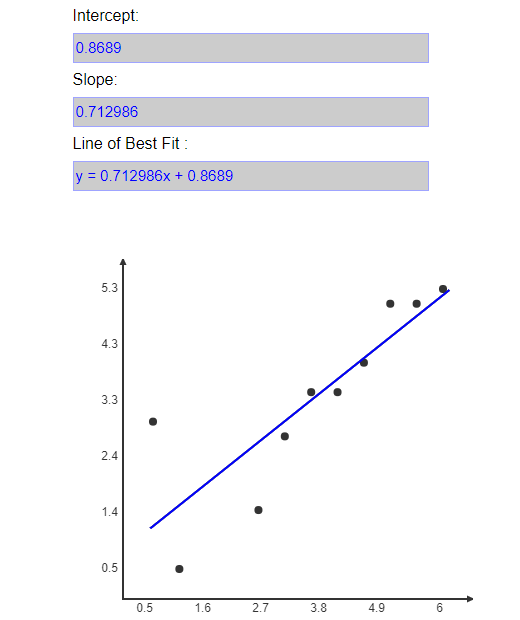
In the above graph, the x-axis represents an independent variable which is the number of hours we put weekly for exercise and y- axis represents the dependent variable which is gained weight loss. From the graph it is clear that the more hours we put in for exercise the more we can gain weight loss. This shows the linear relationship between the hours of exercise and the gained weight loss. Correlation between these two variables is shown by the blue line which is the best fit line for the linear regression problem. The intercept we got is 0.8689 and the slope we got is 0.712986. So the best fit line can be determined as
y = 0.712986x + 0.8689.